01 Context and challenge
Esencial was a new health insurer entering the Chilean market — a sector dominated by five established players, governed by over 466 pages of regulations from the health superintendent, and deeply resistant to digital experiences.
The founding hypothesis: a 100% digital insurer could win on experience in a market where competitors still depended on physical branches and phone calls. The constraint: launch in six months with a small team and no legacy systems.
What needed building
3 products from zero
Plan simulation, digital enrollment, member portal (reimbursements, certificates, policies), and operational back office.
What we were working with
466 pages as spec
The regulatory compendium as our main input. Competitive benchmark (all 5 existing isapres). No existing users to research — pre-launch product. An inexperienced product team needing UX onboarding. Six months to go from blank canvas to live product.
02 My role
I joined as UX Lead with a mandate that covered the full spectrum: strategy, hands-on design, team building, and stakeholder alignment. This was not an execution role — I was expected to define the UX direction, build the internal capability, and make decisions that would shape the product for years.
Over three years, my role evolved from founding designer to design leader overseeing a multi-disciplinary experimentation squad. The two phases — launch and growth — required very different skills and approaches.
03 Phase 1 — Building the MVP
With no users to research before launch, the main input was the regulatory compendium. I read it completely to identify which processes were mandatory, which were discretionary, and where there was room for simplification without compliance risk.
"That deep regulatory reading was the most important design research of the project. It let me reject stakeholder requests with specific regulatory citations — not just intuition."

I conducted a full benchmark of all five competing isapres, mapping their sales flows step by step and scoring them against six UX dimensions. This produced a clear picture of where every competitor was weak — and therefore where Esencial could differentiate on experience, not just price.

The MVP simulation flow reduced the required inputs to 6 questions, producing a results view and a plan detail page that could be completed in under 5 minutes — compared to an industry average that required an agent call.
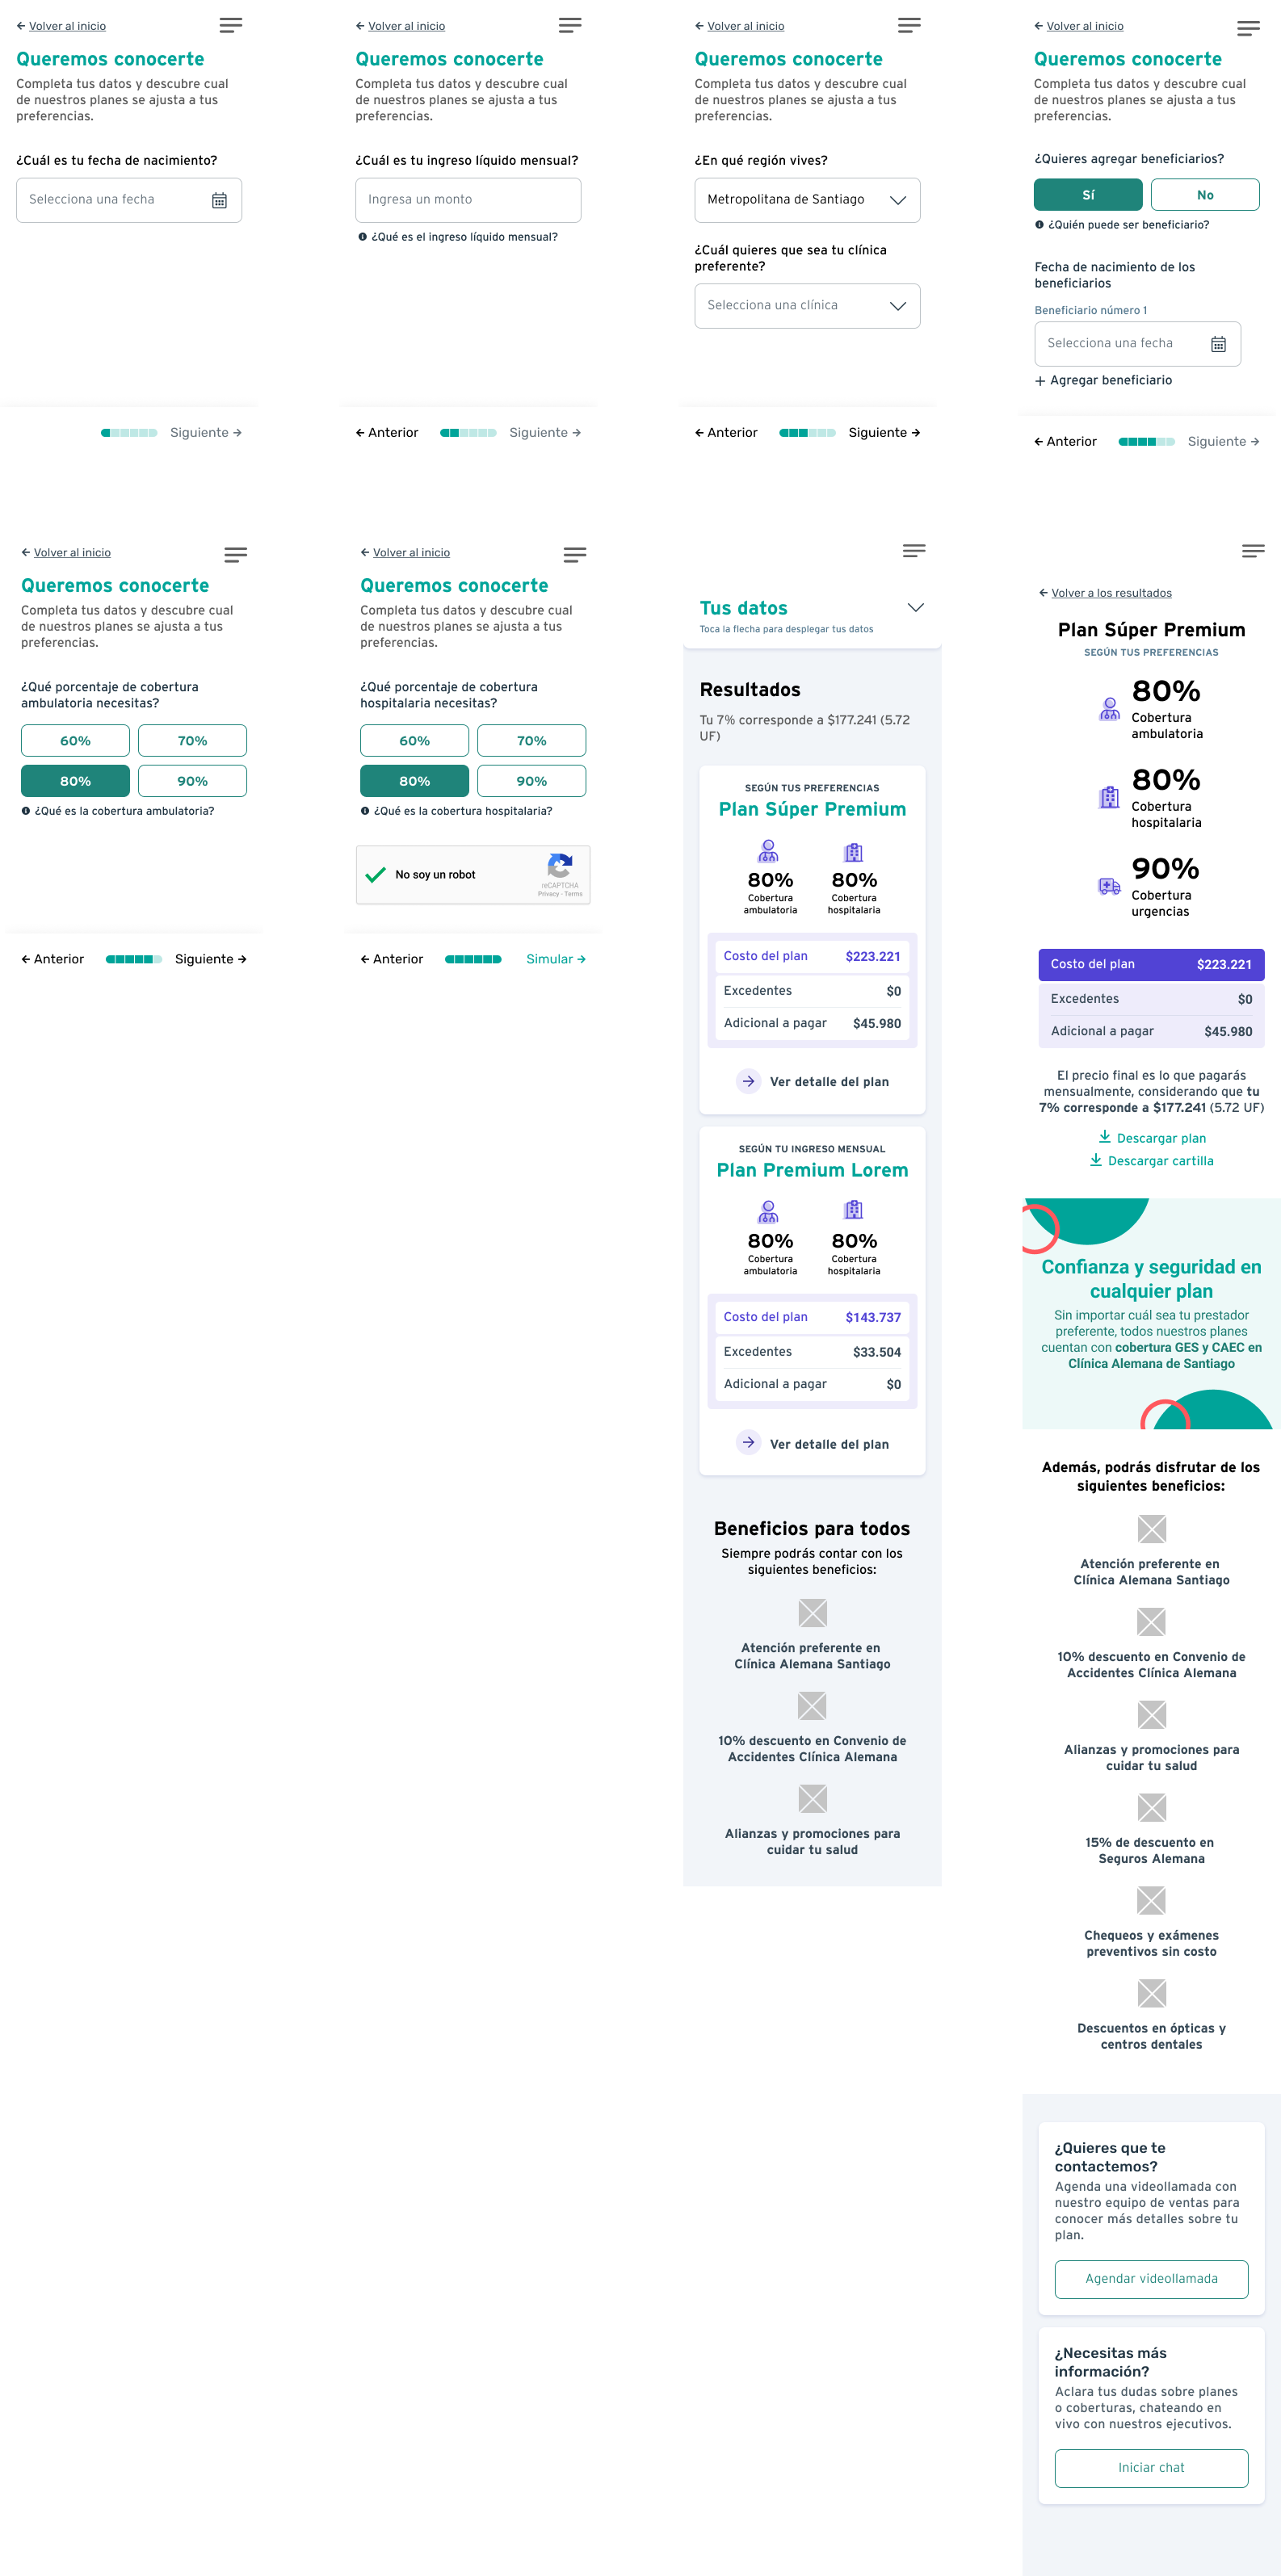
We launched without user testing — a deliberate decision given the confidentiality constraints of a pre-announced financial product. Instead, we monitored post-launch behaviour with Hotjar and Google Analytics from day one.
The first week of real data told us something our internal testing hadn't: users were simulating plans but not converting. And because we hadn't captured any contact information, we had no way to follow up.
04 Phase 2 — Experimentation and growth
Post-launch data made clear that the structure that worked for building didn't work for learning. I proposed and led a restructure into three functions:
1
Maintenance cell
Bounded scope — fixes, accessibility, and roadmap delivery without overloading the team.
2
Experimentation squad
Me as UX Lead + Junior UI + Senior Front + Data Analyst. Complete independence from the roadmap — design, build, test, and launch in one sprint.
3
Rotating mentorship
Program to train junior designers in research methods and data interpretation.
Over 18 months of experimentation, the squad ran and shipped improvements across three critical areas:
1
Lead capture and conversion
We confirmed through a targeted A/B test that users were willing to share contact information in exchange for a follow-up from a digital advisor. Adding a single email capture step at the end of the simulation increased our prospect database significantly and gave the sales team a warm lead pipeline that hadn't existed before.
2
Information architecture and grid
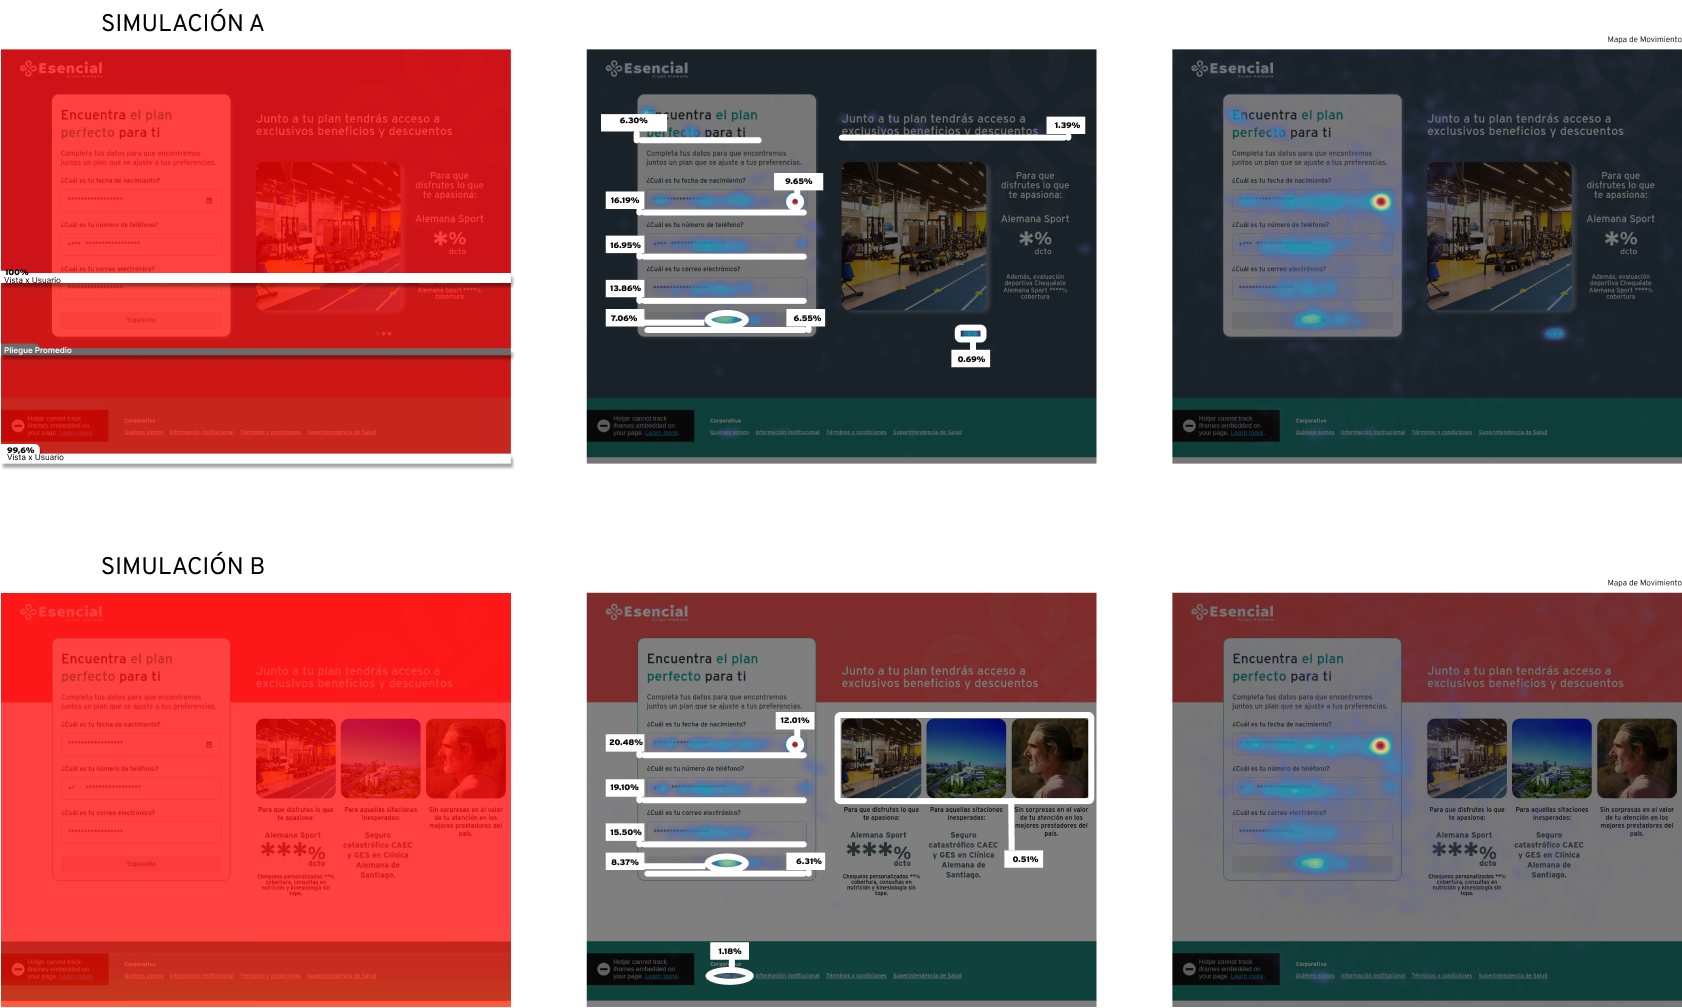
Heatmap analysis revealed that users were consistently missing key comparison information below the fold on mobile. We redesigned the results grid to surface plan differentiators earlier in the scroll, reducing bounce rate on the results page.
3
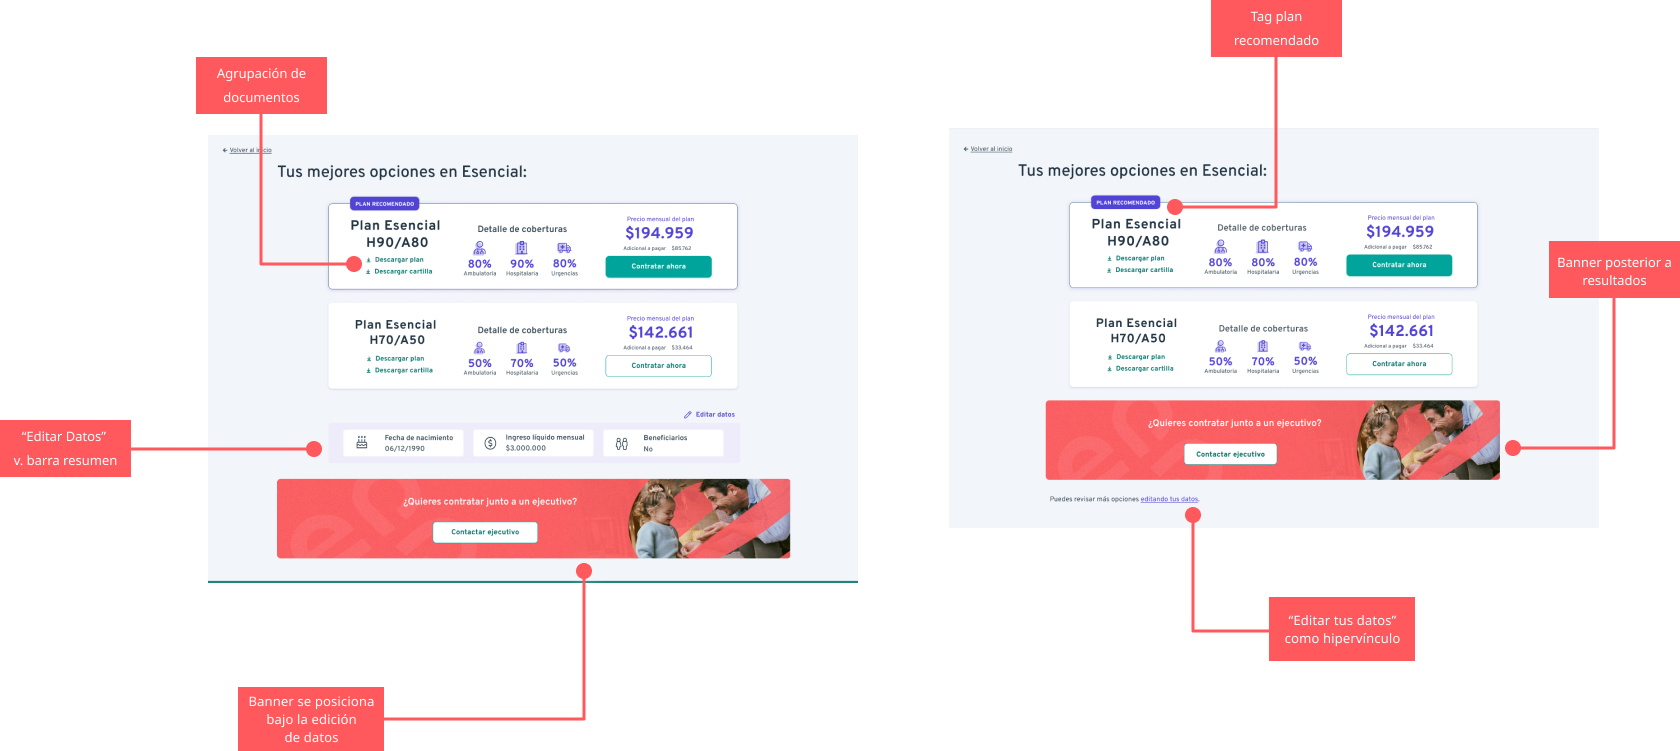
Plan card design
A redesign of the plan comparison cards — improving visual hierarchy and making download CTAs more prominent — increased both document downloads and plan comparison sessions, leading to measurable improvement in time-to-contract for users who engaged with the comparison features.
4
Flow compression
After reducing the number of interactions on several screens, task completion time remained constant but user-reported perception of the process improved significantly. Users described the flow as 'faster' and 'simpler' even though the clock time hadn't changed — a reminder that perceived effort is as important as measured effort.
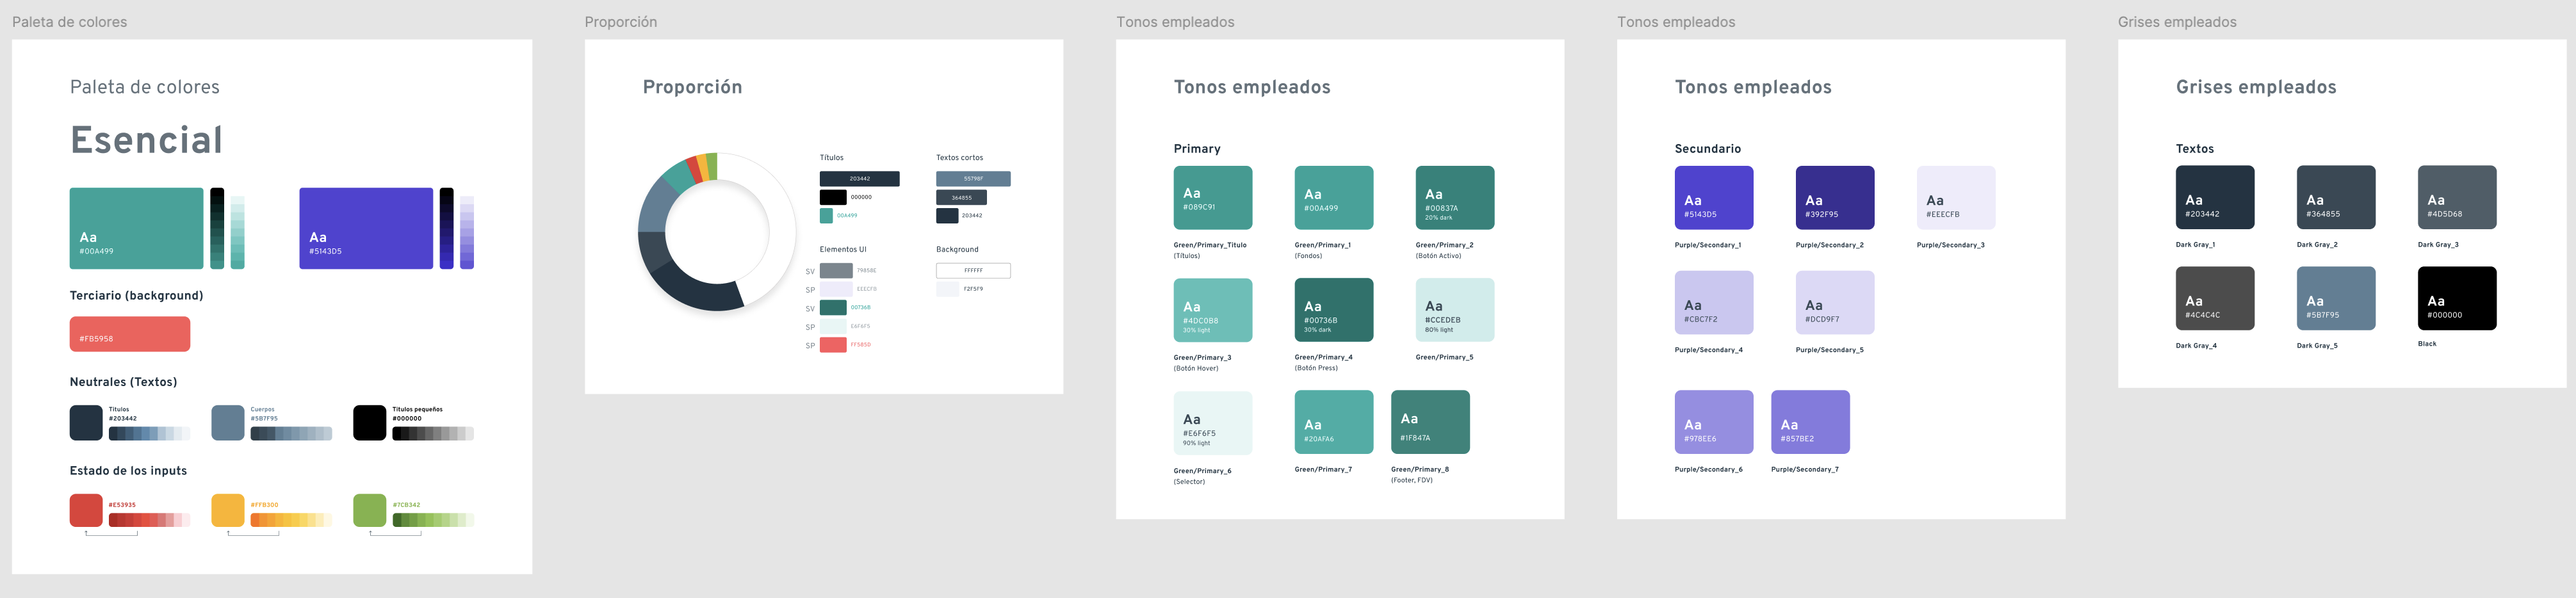
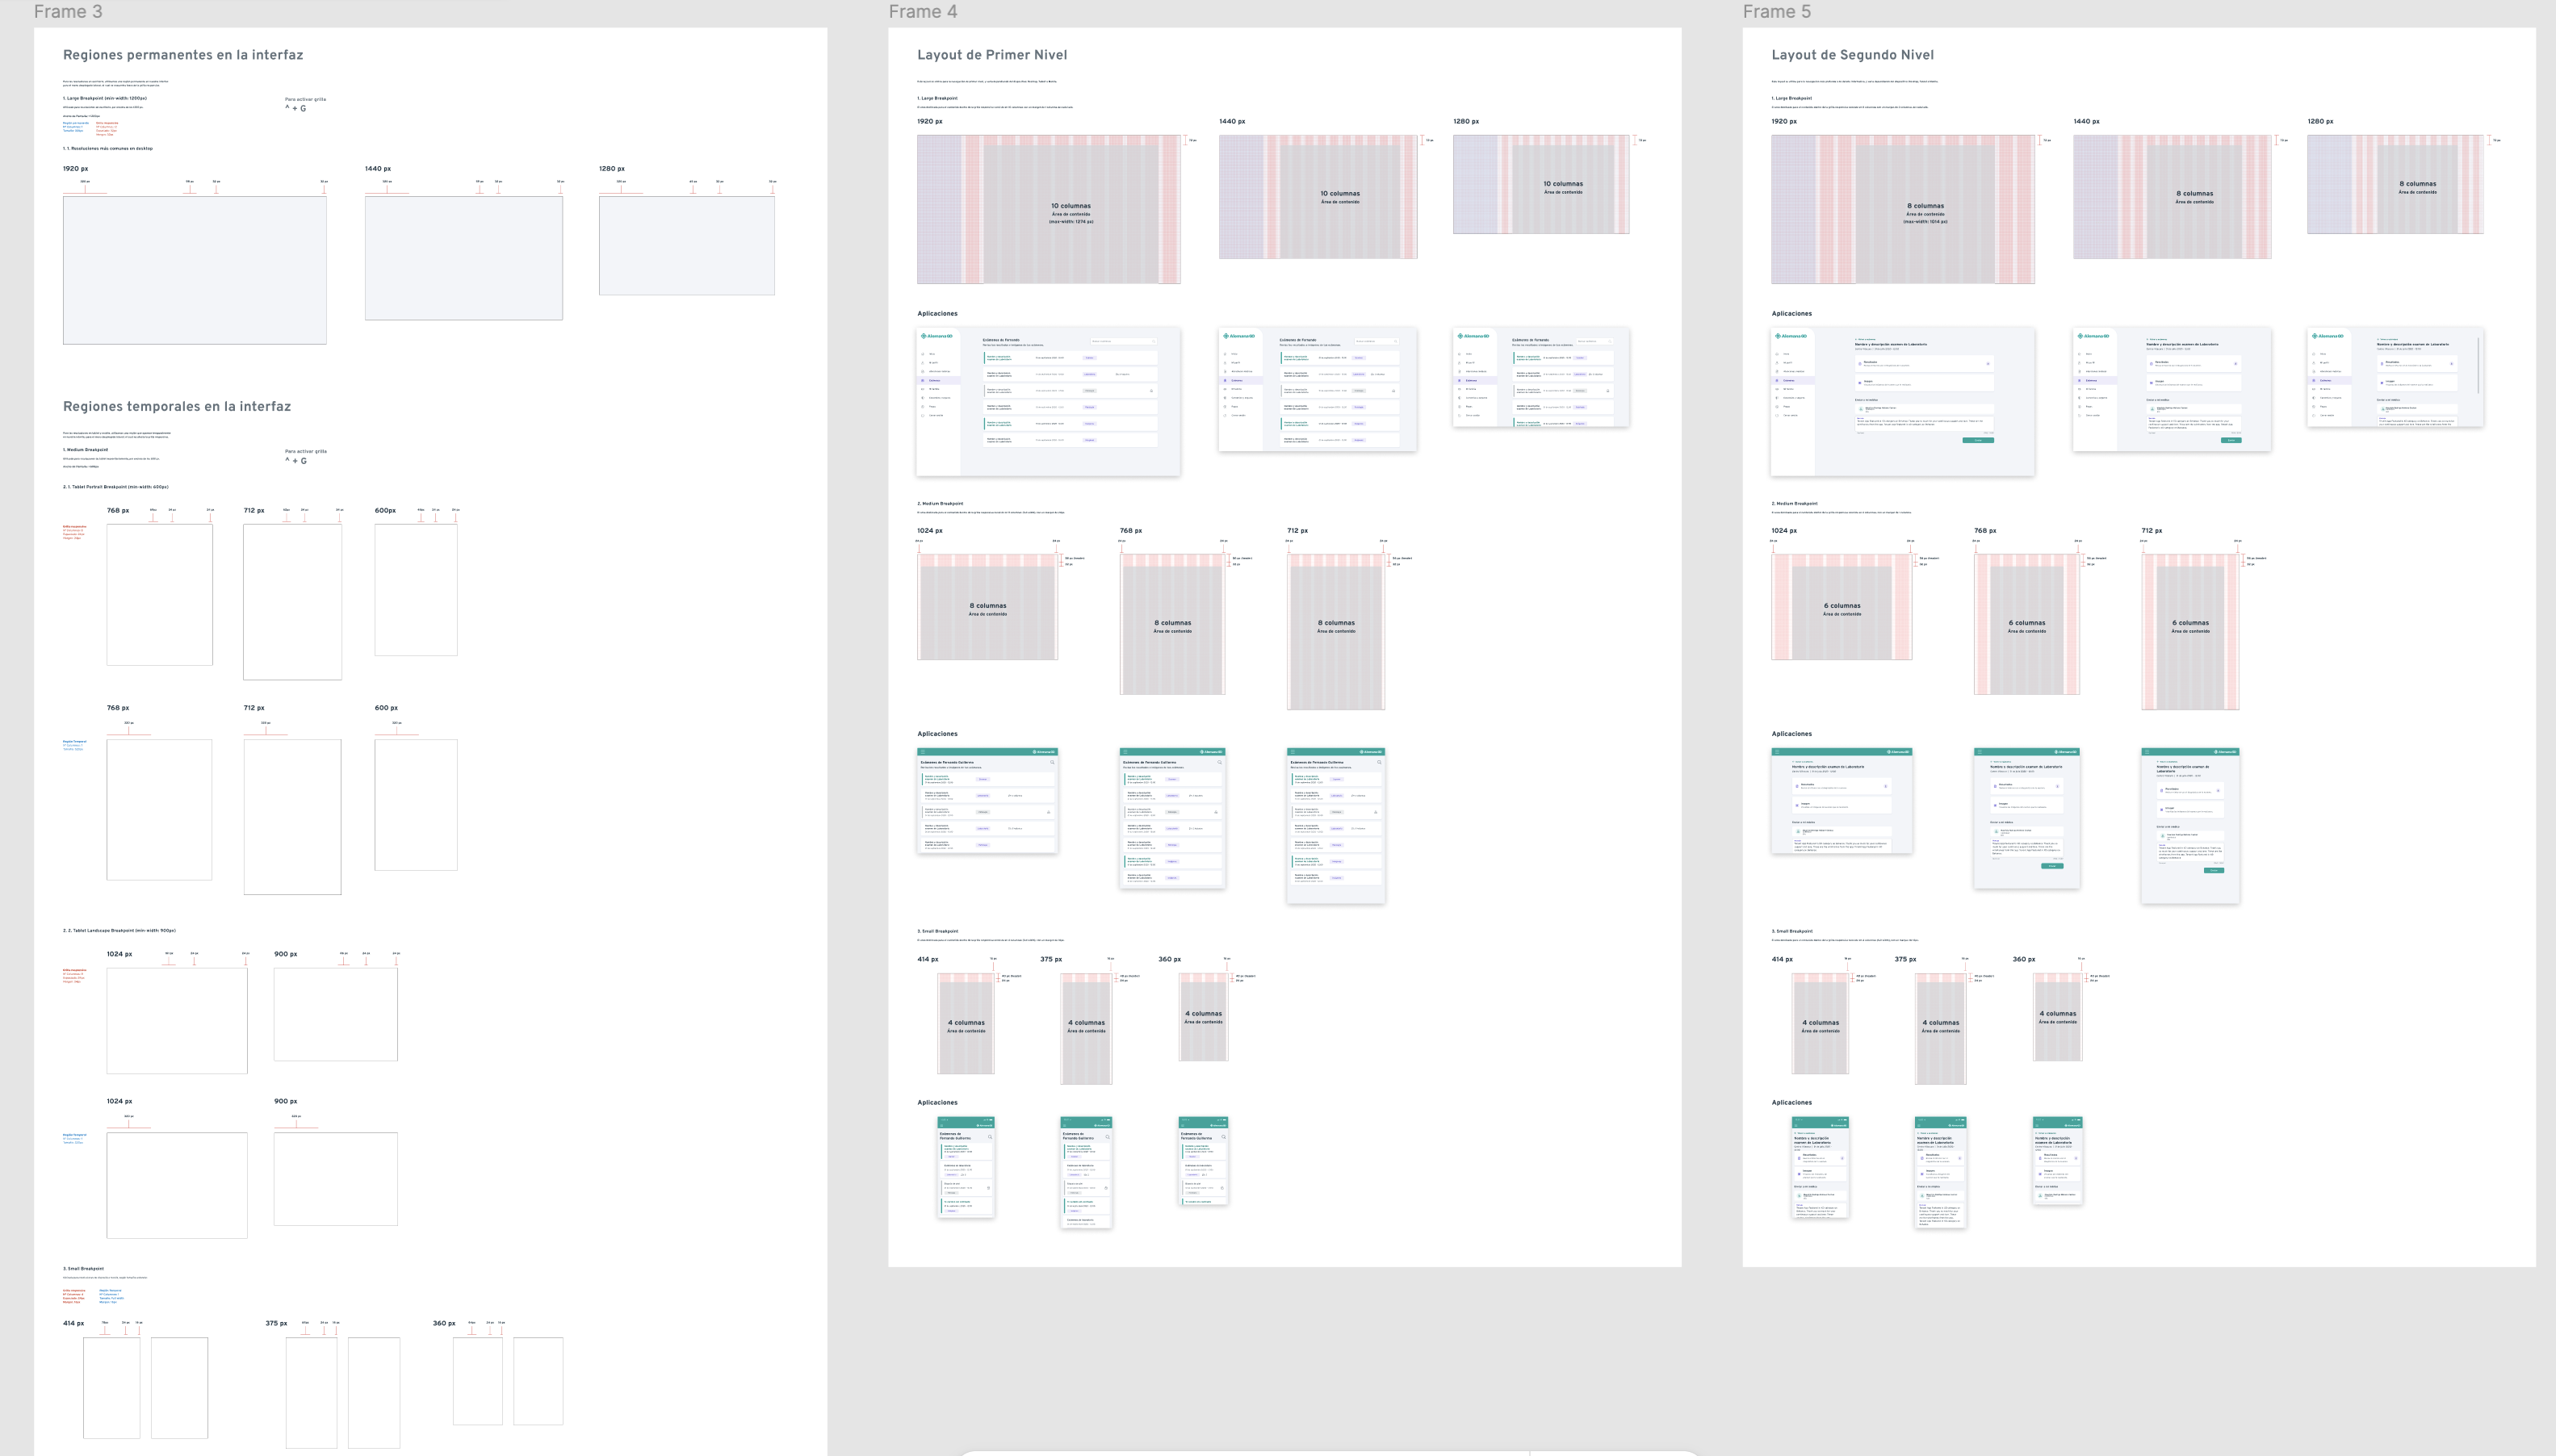
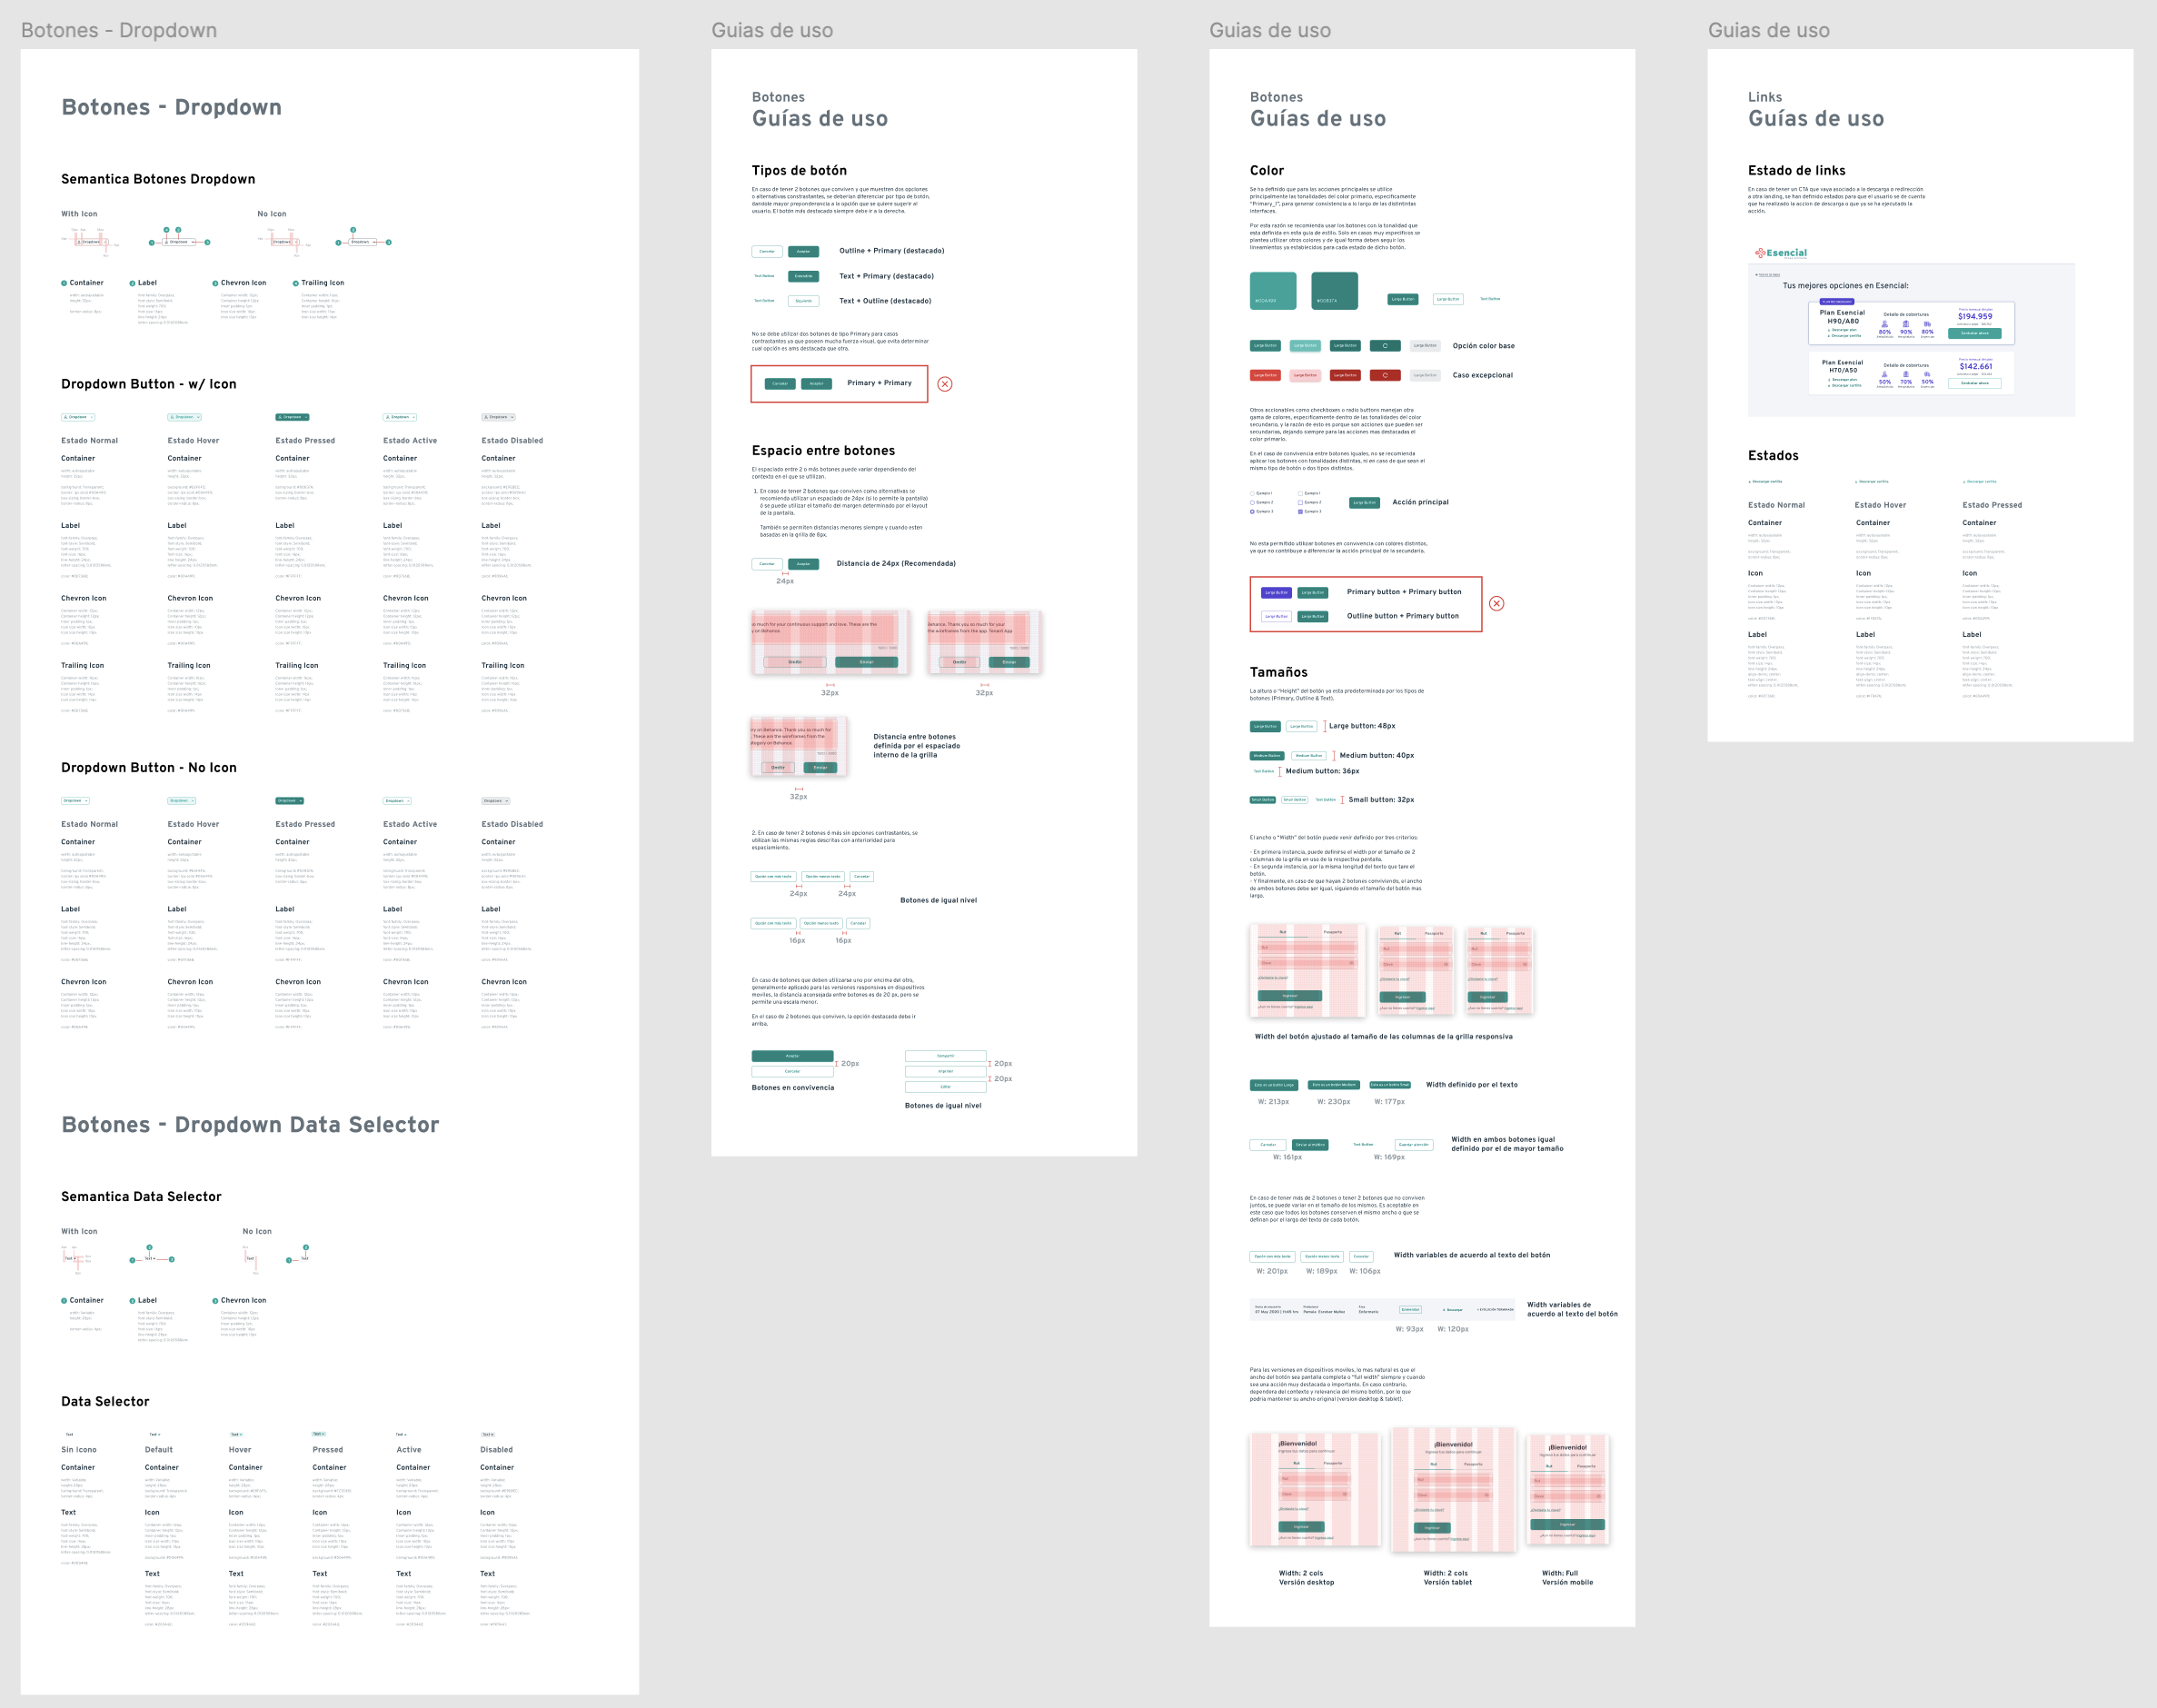
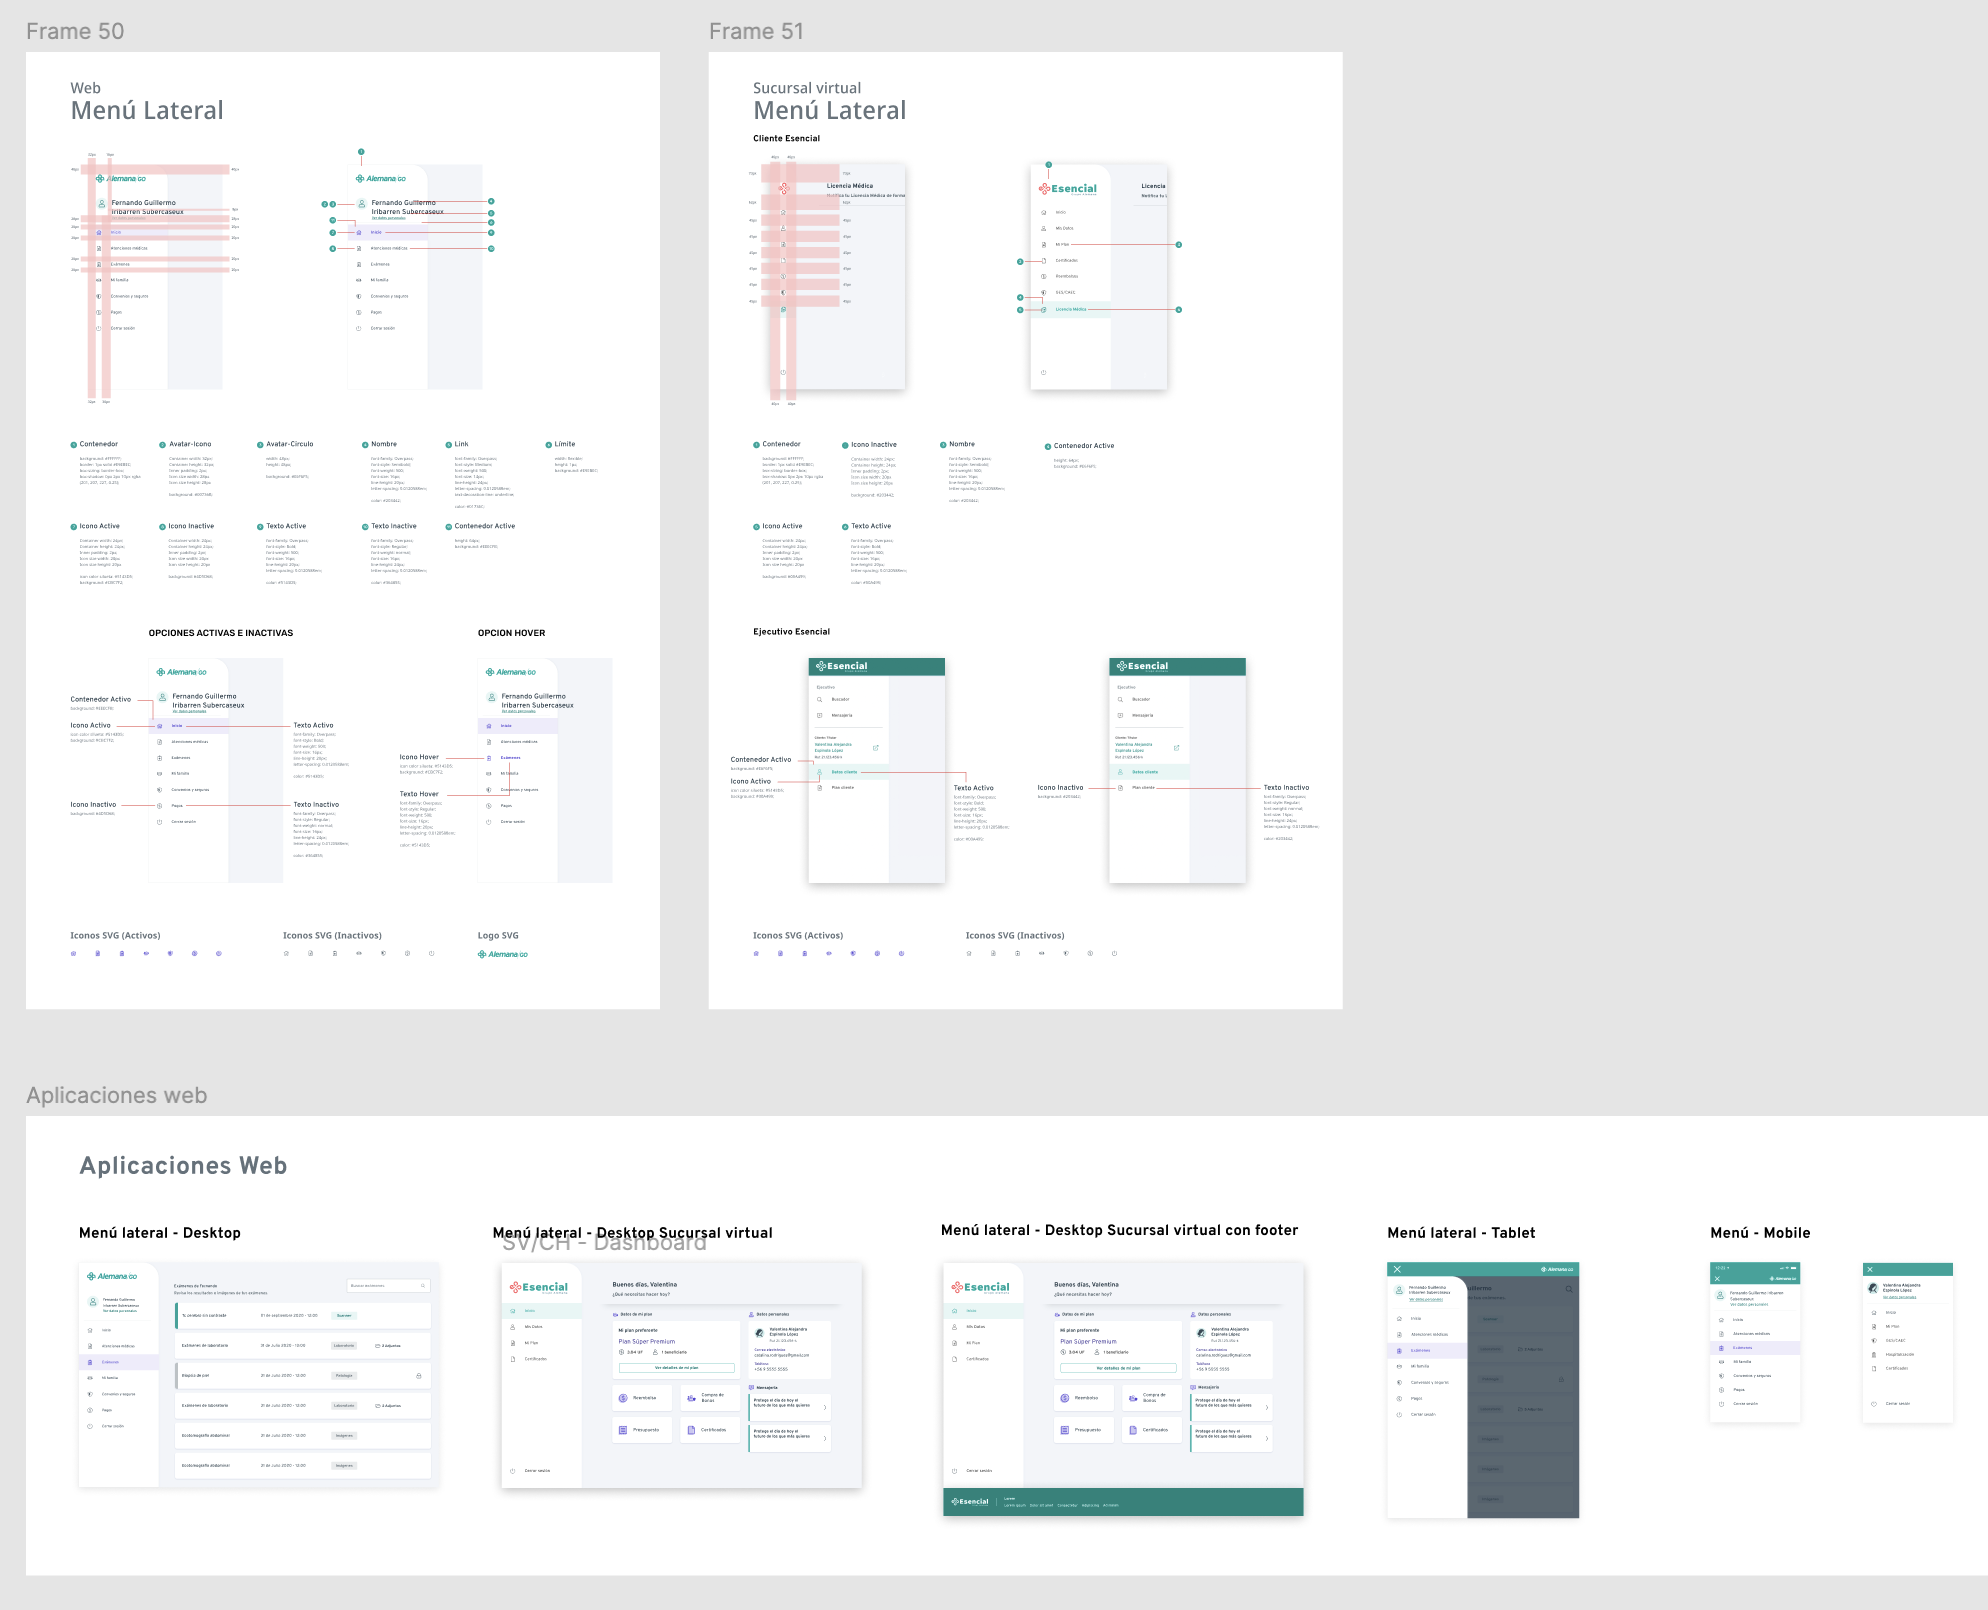
05 Design system
As scope grew to include the member portal, back office, and multiple communication touchpoints, I led the definition and documentation of our Figma component library — naming conventions, interaction states, responsive behavior, and documentation standards.
06 Results
6 mo.
Time to full product launch
From blank canvas to production product
↑↑
Lead conversion rate (post-capture experiment)
Post email capture experiment
↑↑
Plan document downloads post-card redesign
After plan card redesign
−
Acquisition cost vs traditional development
Validated by data analytics team
Note: specific conversion figures are confidential under NDA. Results are directional and validated by the data analytics team.
Beyond the numbers, the team built something equally valuable: an internal culture of evidence-based design in a company that had previously operated on stakeholder intuition. The shift from 'I think users want X' to 'here's what the data shows' was a direct outcome of the experimentation model I built.
"With the results of the squad we have confirmed to Management that we do not need large resources to do research — failing fast allows us to find findings more frequently and reduce acquisition costs."
Internal stakeholder review
07 Key learnings
Structure determines speed
The most impactful design decision I made in this project wasn't a UI choice — it was a team structure choice. Creating a dedicated experimentation squad with its own autonomy and resourcing unlocked a level of iteration speed that was impossible before. If you want to do evidence-based design at scale, you have to design the team as carefully as you design the product.
Regulation as a design input, not a constraint
Working within 466 pages of regulatory requirements could have paralysed the process. Instead, I treated the compendium as primary research — a source of hard constraints that, once understood, gave us clarity on where we had freedom to simplify. Designers who avoid regulatory reading miss the most important source of product truth in regulated industries.
Proving design value in an analog organization
Esencial was a digital-first product inside a company with deeply analog instincts. Every design decision required making the business case in business terms — not design terms. That discipline — translating UX outcomes into acquisition cost, conversion rate and operational efficiency — is what earned the design team a seat at the strategy table.